


Der Energiebeschaffungszyklus hat sich hin zu einem primär digitalen Bewertungsmodell gewandelt. Für Führungskräfte von Energieversorgern und Netzbetreibern stellt die mangelnde Anpassung der externen Kommunikation an diesen Wandel ein messbares finanzielles Risiko dar. Ineffiziente Vertriebsprozesse korrelieren nun direkt mit höheren Kapitalkosten und operativer Volatilität.
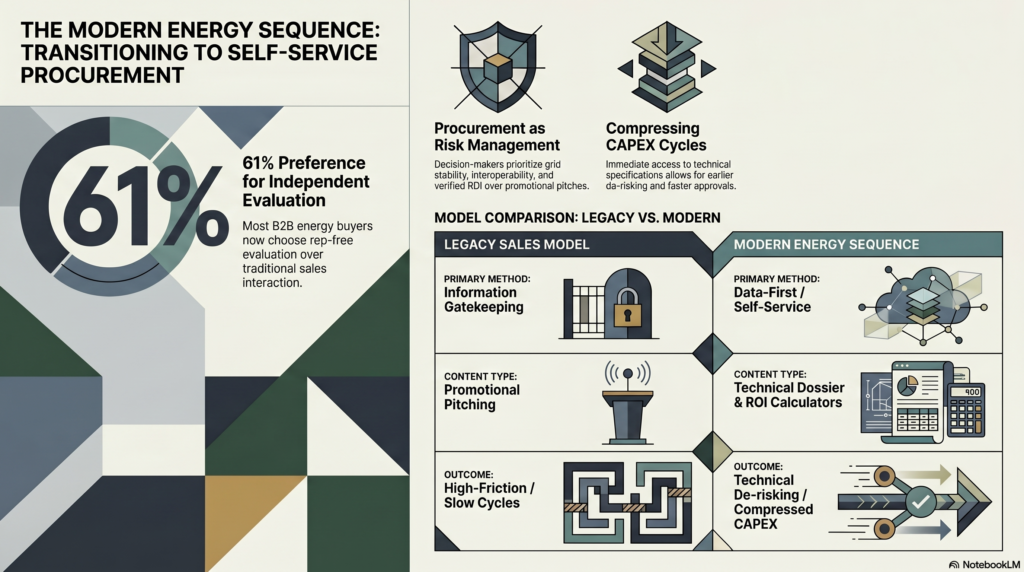
B2B-Vertriebssequenzen im Energiesektor sind datengestützte Kommunikationsframeworks, die eine autonome technische Bewertung ermöglichen. Dieser Wandel wird durch den “61%-Haken” notwendig – eine Marktrealität, bei der 61% der B2B-Käufer ihre Bewertung selbstständig durchführen, bevor sie einen Vertriebsmitarbeiter kontaktieren. Die Anwendung dieses Modells ist unerlässlich, um die “9:1-Bewertungsfalle” zu vermeiden. In diesem Szenario veranlassen hohe Kundenakquisitionskosten (CAC) und CO₂-intensive Wachstumsmodelle institutionelle Kreditgeber dazu, die gewichteten durchschnittlichen Kapitalkosten (WACC) eines Unternehmens zu erhöhen. Aktuelle Marktdaten bestätigen, dass Verzögerungen bei der Beschaffung KI-gestützter Lastmanagementlösungen zu einem Anstieg der Ausgleichskosten um 15% und in der Folge zu regulatorischen Strafzahlungen geführt haben.
Der operative Spielraum für Fehler hat sich verringert. Für einen regionalen Netzbetreiber hängt der Unterschied zwischen einer erfolgreichen Integration und einem signifikanten EBITDA-Rückgang oft von der Geschwindigkeit und der technischen Genauigkeit der anfänglichen Beschaffungsphase ab.
Die strategische Notwendigkeit des Selbstbedienungsmodells
Einkaufsleiter im Energiesektor agieren als Risikomanager. Ihr Hauptziel ist die Sicherstellung von Netzstabilität, Interoperabilität und langfristiger Rentabilität. Wenn 61% der Käufer eine Bewertung ohne Vertriebsmitarbeiter bevorzugen, muss die erste Verkaufsphase eher einem technischen Dossier als einem Werbeangebot gleichen.
Eine effiziente Vorgehensweise liefert die notwendigen Komponenten eines Business Case – technische Spezifikationen, Integrationsstandards und ROI-Rechner – umgehend. Dies reduziert den Aufwand für COOs und Betriebsleiter, die Lösungen anhand strenger Netzanforderungen prüfen müssen. Durch die Bereitstellung von Self-Service-Ressourcen ermöglichen Anbieter eine frühzeitige technische Risikominimierung und verkürzen so effektiv lange Investitionszyklen.
Die 9:1-Bewertungsfalle quantifizieren
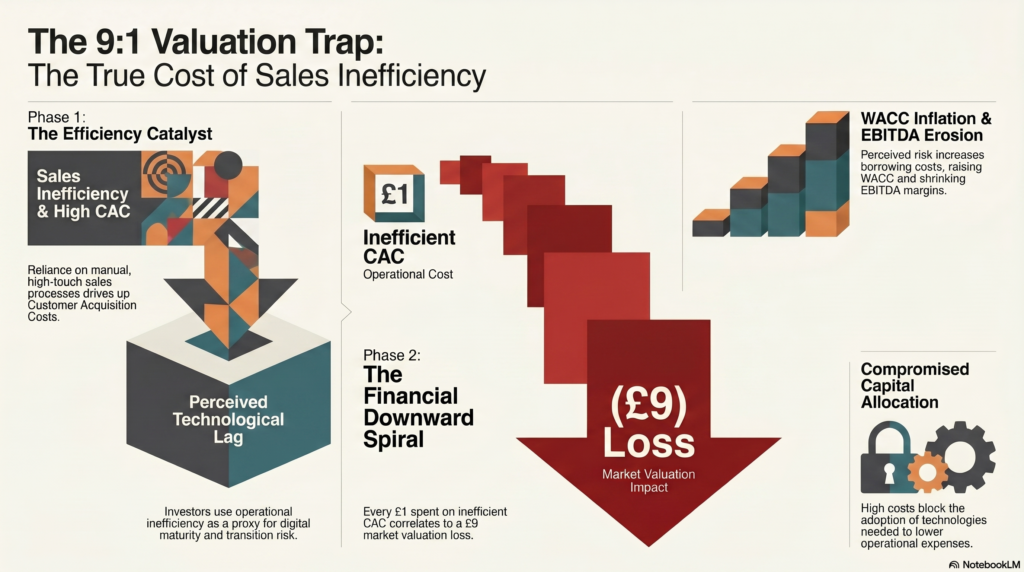
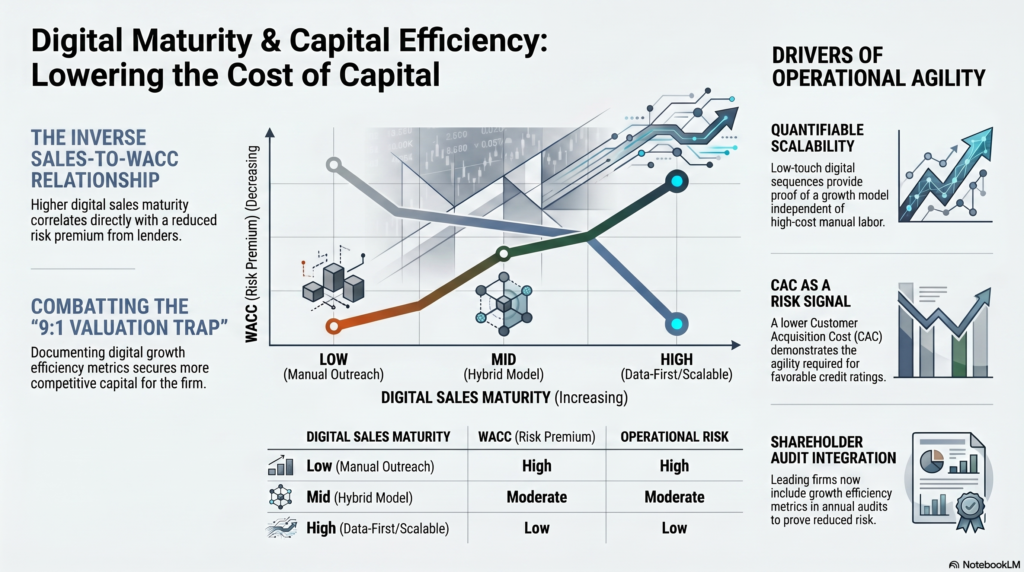
Die 9:1-Bewertungsfalle beschreibt die unverhältnismäßigen Auswirkungen von Vertriebsineffizienzen auf den Marktwert eines Unternehmens. Im aktuellen Kreditumfeld kann ein Unternehmen für jeden Pfund, der für ineffiziente Kundenakquisitionskosten (CAC) ausgegeben wird, einen potenziellen Wertverlust von neun Pfund hinnehmen müssen. Dies geschieht, weil Kreditgeber die gewichteten durchschnittlichen Kapitalkosten (WACC) erhöhen, um den wahrgenommenen “technologischen Rückstand” im Wachstumsmodell des Unternehmens auszugleichen.
Institutionelle Anleger nutzen zunehmend digitale Reife und operative Effizienz als Indikatoren für das Transformationsrisiko. Unternehmen, die auf manuelle, auf persönlichen Kontakt angewiesene Vertriebsprozesse setzen, gelten oft als weniger fähig, die Komplexität der Energiewende zu bewältigen. Dies führt zu höheren Fremdkapitalkosten, die das EBITDA schmälern und die Finanzierungsschwelle für kritische Infrastrukturprojekte erhöhen.
WACC und Kapitalallokation
Höhere Kapitalkosten (WACC) beeinträchtigen unmittelbar die Wirtschaftlichkeit neuer Integrationen erneuerbarer Energien. Steigen die Kapitalkosten aufgrund von Ineffizienzen im Wachstumsmodell, wird die Fähigkeit des Unternehmens, die zur Senkung der Betriebskosten notwendigen Technologien einzuführen, gefährdet. Dies führt zu einem Teufelskreis aus anhaltend hohen Kosten und regulatorischer Anfälligkeit.
Auswirkungen von Verzögerungen im Beschaffungswesen auf die Bilanzkosten und das EBITDA
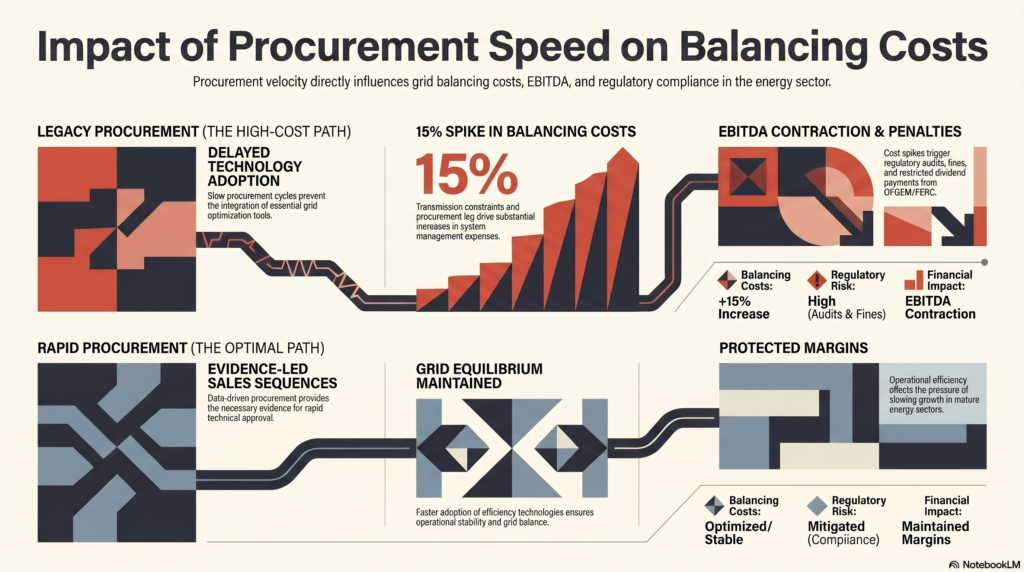
Technologische Verzögerungen sind nicht neutral, sondern ziehen konkrete finanzielle Konsequenzen nach sich. Im Energiesektor zeigen sich diese am deutlichsten in den Ausgleichskosten – den Ausgaben zur Aufrechterhaltung des Netzgleichgewichts. Laut Ofgems Marktbericht 2026, Systemmanagement- und Ausgleichskosten bleiben kritische Bestandteile der Energieausgaben, wobei Übertragungsengpässe zu einem deutlichen Anstieg dieser Kosten führen.
Daten regionaler Netzbetreiber zeigen, dass verzögerte Technologieeinführungen zu einem Anstieg der Ausgleichskosten um 151 TP3T führen können. Diese Kostenspitzen ziehen häufig behördliche Prüfungen und Bußgelder nach sich, was einen deutlichen Rückgang des EBITDA zur Folge hat. Die Beschaffungsgeschwindigkeit ist daher ein entscheidender Faktor für die Aufrechterhaltung der Betriebsstabilität und des Aktionärsvertrauens. BloombergNEF (BNEF) stellt fest, dass die globalen Investitionen in die Energiewende zwar einen Rekordwert erreichten, $2,3 Billionen im Jahr 2025, Das Wachstum in reifen Sektoren verlangsamt sich, wodurch der Druck auf die operative Effizienz steigt, um die Gewinnmargen zu halten.
Regulierungs- und Compliance-Risiken
Regulierungsbehörden ahnden mittlerweile Prozessineffizienzen, die die Netzoptimierung behindern. In den von OFGEM oder FERC regulierten Gebieten kann die Nichtnutzung verfügbarer Effizienztechnologien zu eingeschränkten Dividendenzahlungen und verpflichtenden Abhilfemaßnahmen führen. Evidenzbasierte Vertriebsprozesse mindern dieses Risiko, indem sie die für eine schnelle technische Genehmigung erforderlichen Daten liefern.
Struktur einer evidenzbasierten Verkaufssequenz
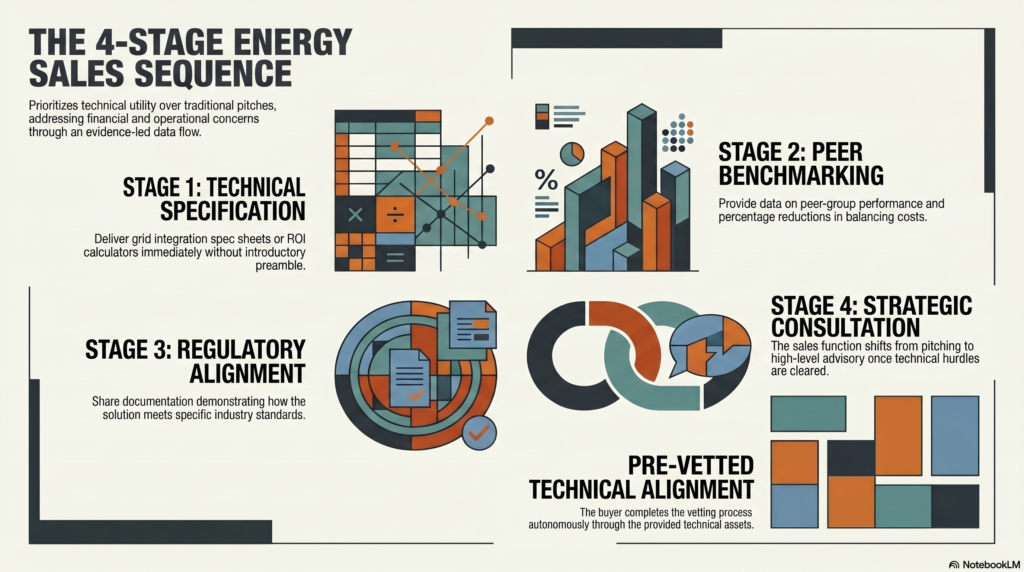
Eine hochrangige B2B-Energiesequenz priorisiert den technischen Nutzen. Sie liefert Daten in Etappen und geht dabei auf die spezifischen finanziellen und operativen Belange der Führungsebene ein.
- Erste Kontaktaufnahme: Technische Spezifikation. Liefern Sie ein Datenblatt zur Netzintegration oder einen ROI-Rechner. Verzichten Sie auf einleitende Vorbemerkungen.
- Sekundäre Öffentlichkeitsarbeit: Peer-Benchmarking. Stellen Sie Daten zur Leistung vergleichbarer Gruppen bereit, wobei der Schwerpunkt auf prozentualen Reduzierungen der Ausgleichskosten liegen sollte.
- Hochschulbildung: Angleichung an regulatorische Vorgaben. Bitte dokumentieren Sie, wie die Lösung spezifische Standards erfüllt.
Diese Struktur stellt sicher, dass der Käufer den technischen Prüfprozess bereits abgeschlossen hat, wenn ein direktes Treffen angefragt wird. Die Vertriebsfunktion wandelt sich somit in eine strategische Beratung.
Vertriebseffizienz als Treiber für niedrigere WACC
Finanzvorstände können Kennzahlen zur Vertriebseffizienz als Indiz für digitale Reife gegenüber institutionellen Kreditgebern nutzen. Niedrigere Kundenakquisitionskosten (CAC) und ein effizienter Weg zur Technologieimplementierung belegen operative Agilität. Diese Nachweise können genutzt werden, um eine reduzierte Risikoprämie auszuhandeln.
Datenbasierte, ressourcenschonende Prozesse liefern den messbaren Beweis für ein skalierbares Wachstumsmodell. Wenn ein Unternehmen Umsätze über effiziente digitale Kanäle generieren kann, reduziert es seine Abhängigkeit von manueller Arbeit und kostenintensiver Kundenansprache. Diese Skalierbarkeit ist eine grundlegende Voraussetzung für gute Kreditratings in einem volatilen Energiemarkt.
Offenlegung und Aktionärsprüfungen
Führende Unternehmen integrieren mittlerweile Kennzahlen zur Wachstumseffizienz in ihre jährlichen Aktionärsprüfungen. Indem sie den Zusammenhang zwischen der Reife des digitalen Vertriebs und dem reduzierten operationellen Risiko dokumentieren, bekämpfen diese Unternehmen effektiv die “9:1-Bewertungsfalle” und sichern sich wettbewerbsfähigeres Kapital.
Wichtigste Erkenntnisse
- Implementieren Sie den 61%-Hook: Priorisieren Sie die Bereitstellung technischer Spezifikationen und ROI-Rechner, um eine autonome Käuferbewertung zu unterstützen.
- Die 9:1-Bewertungsfalle entschärfen: Erkennen Sie, dass Ineffizienz im Vertrieb ein finanzielles Risiko darstellt, das die WACC erhöht und die Marktbewertung mindert.
- Beschaffungsgeschwindigkeit optimieren: Eine rasche Einführung neuer Technologien ist erforderlich, um sprunghafte Anstiege bei den Ausgleichskosten und behördlichen Strafen zu vermeiden.
- Evidenz hat Vorrang vor Quantität: Die Öffentlichkeitsarbeit muss mit technischen Daten und Vergleichswerten aus der Vergleichsgruppe beginnen, um die Aufmerksamkeit der Führungsebene zu gewinnen.
- Digitale Signalreife: Nutzen Sie die Vertriebseffizienz als Kennzahl, um institutionellen Kreditgebern und Investoren Ihre operative Agilität zu beweisen.
Häufig gestellte Fragen
Warum gilt 61% als Maßstab für unabhängige Evaluierungen?
Untersuchungen zeigen, dass 611 von 30 Einkaufsleitern Lösungen prüfen, bevor sie den Vertrieb kontaktieren. Technische Einkäufer benötigen datengestützte Nachweise, um sich mit internen Entwicklungs- und Finanzverantwortlichen abzustimmen.
Wie wirkt sich ein ineffizientes Vertriebsmodell auf die WACC aus?
Ineffizienz deutet auf mangelnde digitale Reife hin. Kreditgeber sehen darin ein Risiko für die Fähigkeit des Unternehmens, die Energiewende zu bewältigen, was zu höheren Fremdkapitalkosten führt.
Was genau ist ein “Self-Service Resource Hub” in einer E-Mail?
Es handelt sich um eine Sequenz, die direkten Zugriff auf uneingeschränkte technische Dokumentation, API-Spezifikationen und Finanzmodellierungswerkzeuge bietet und es dem Käufer ermöglicht, selbstständig einen Business Case zu erstellen.
Können Verkaufssequenzen die Kosten für den Netzausgleich beeinflussen?
Ja. Effiziente Abläufe beschleunigen die Beschaffung von Lastmanagement- und Optimierungsinstrumenten, die für die Aufrechterhaltung des Netzgleichgewichts und die Vermeidung von Bußgeldern im Zusammenhang mit Volatilität unerlässlich sind.
Welcher Datenpunkt eignet sich am besten für die erste Kontaktaufnahme?
Direkter Vergleich mit vergleichbaren Unternehmen, wie beispielsweise eine dokumentierte prozentuale Reduzierung der Betriebskosten bei einem ähnlichen Energieversorger oder Netzbetreiber.
Wie wird der Erfolg einer Selbstbedienungssequenz gemessen?
Der Erfolg wird daran gemessen, wie schnell ein potenzieller Kunde die technische Prüfung abschließt und in die interne Genehmigungsphase übergeht, und nicht an traditionellen Kennzahlen wie Öffnungsraten.
Über den Autor
Projekt 54 Analyseteam ist ein erfahrenes strategisches Team bei Project 54 mit mehr als 20 Jahren Erfahrung im B2B-Unternehmensvertrieb und Kapitalmarkt, mit Schwerpunkt auf operativer Effizienz in den Bereichen Energie und SaaS.
Erkunden Sie dieses Thema weiter
[PODCAST-PLAYER: Die finanziellen Auswirkungen von Vertriebseffizienz im Energiesektor] Hören Sie sich die zugehörige Diskussion zu diesem Thema an. 18 Minuten. Folge herunterladen
[PRÄSENTATION: Die 9:1-Bewertungsfalle vermeiden] Laden Sie die Präsentation herunter, die die wichtigsten Erkenntnisse aus diesem Artikel zusammenfasst. Präsentation herunterladen (PDF) | Präsentation herunterladen (PPTX)
Externe Links: