










Путь независимого покупателя и нерациональное распределение капитала
К тому моменту, когда корпоративный покупатель энергии инициирует контакт с отделом продаж поставщика, Этап 61% процесса принятия решений завершен.. В условиях ограниченного капитала в сфере закупок опора на устаревшие, ориентированные на исходящие коммерческие стратегии представляет собой неэффективное распределение корпоративного капитала. Группы корпоративных закупок отдают приоритет самостоятельным оценкам без участия представителей, при этом До 80% этапов процесса покупки в сегменте B2B происходят без прямого контакта с поставщиком.. Неспособность уловить эти ранние сигналы о намерениях приводит к систематическому исключению из цикла рассмотрения. Для устранения этого пробела энергетическим и промышленным компаниям необходимо внедрить структурированные системы цифрового маркетинга, подробно описанные в [ссылка на систему]. Веб-сайт проекта 54, для отслеживания поведения до совершения намерения и защиты операционной прибыли.
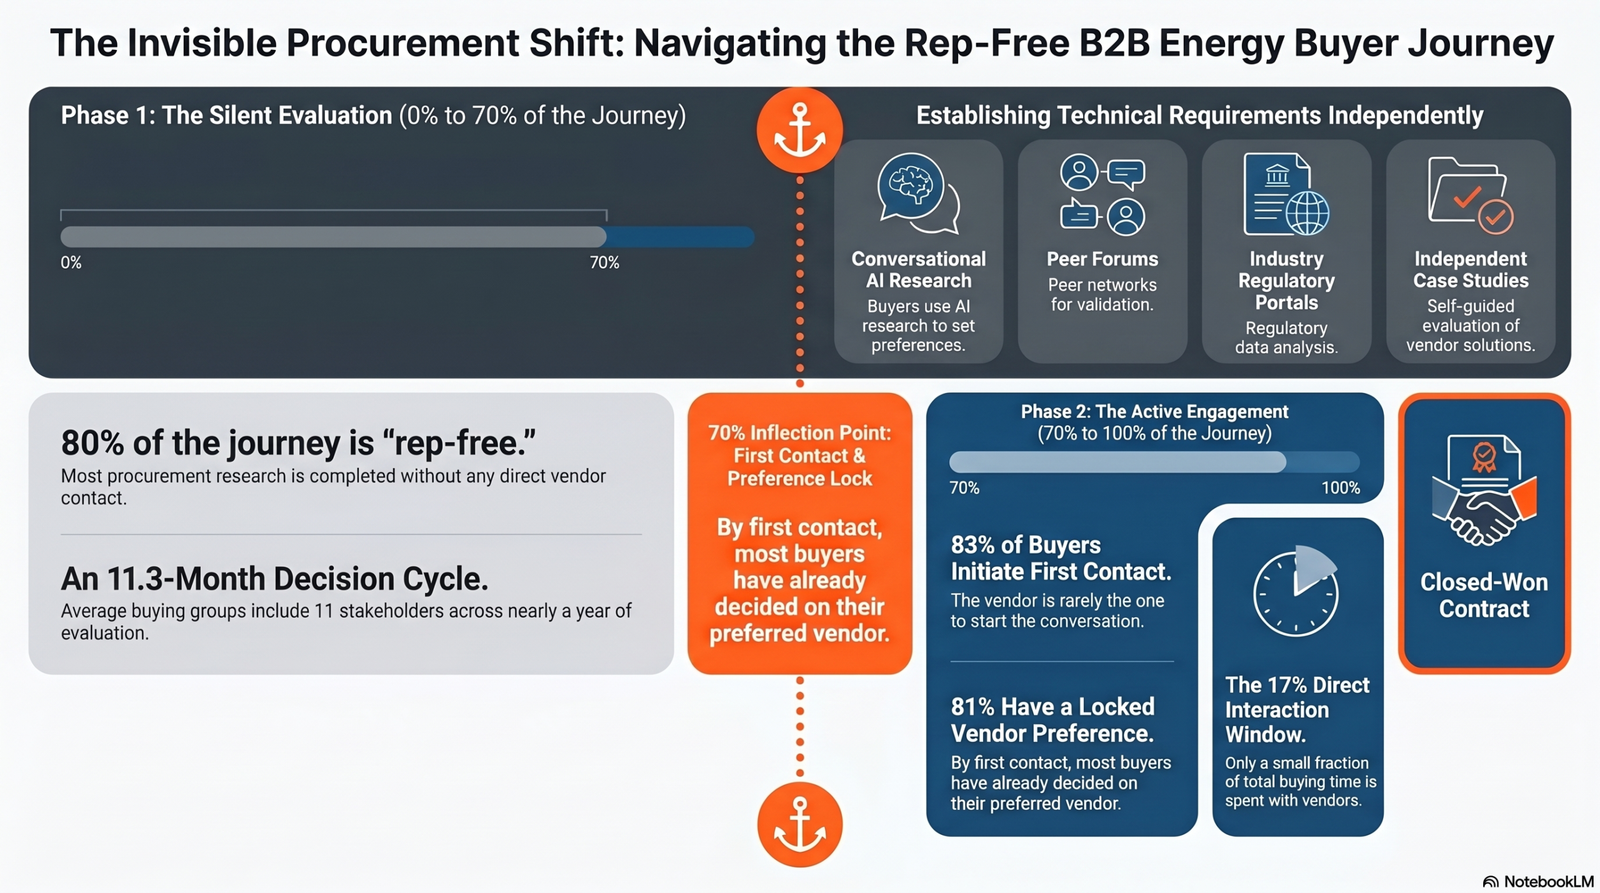
Количественная оценка финансовых последствий ловушки оценки 9:1
Промышленные и энергетические компании часто нерационально распределяют капитал, Сосредоточение 90% бюджетов продаж и маркетинга на 5%-10% рынка, активно осуществляющего закупки. В любой момент времени. Такая чрезмерная зависимость от тактики холодных исходящих звонков, основанной на объеме, серьезно вредит финансовому положению компании.
Широкие исходящие последовательности, выполняемые без проверки домена, увеличивают общую стоимость привлечения клиента (CAC). Холодные исходящие каналы в среднем CAC составляет $1,980, в то время как содержание органических веществ в CAC является определяющим фактором. диапазоны от $480 до $1,500. Высокий показатели отказов от 35% до 40% Это наносит непоправимый ущерб репутации домена, что снижает доставляемость и увеличивает последующие затраты на привлечение клиентов. Учитывая, что цикл продаж в энергетической отрасли обычно длится от 6 до 18 месяцев, краткосрочные контакты приводят к низким показателям конверсии MQL в SQL, что увеличивает сроки окупаемости и снижает рыночную стоимость компании.
Операционная реструктуризация: пример компании EnerTech Solutions
Операционные риски устаревших коммерческих структур демонстрируются на примере компании EnerTech Solutions, поставщика корпоративных энергетических технологий. Исторически сложилось так, что отдел продаж полагался на автоматизированные рассылки электронных писем, адресованные корпоративным клиентам коммунальных предприятий. Потенциальные покупатели игнорировали эту рассылку, проводя независимые исследования стратегий ESG и нормативных требований.
Поскольку компания не имела видимости в поисковых системах, использующих разговорный ИИ, она была полностью исключена из этапа самостоятельной оценки. Показатели конверсии MQL в SQL. упало ниже 10%, Циклы продаж раздулись, а соотношение пожизненной ценности клиента к стоимости привлечения клиента (LTV:CAC) приблизилось к пороговому значению 1:1, что привело к снижению оценки компании, в то время как средневзвешенная стоимость капитала (WACC) оставалась высокой.
Последующий поворот событий заключался в интеграции данных о намерениях сторонних источников для выявления коммунальных компаний, активно изучающих обязательства по соблюдению нормативных требований. Эти данные напрямую поступали в автоматизированные рабочие процессы для немедленного обогащения лидов. Вместо рассылки холодных писем клиентам, отдел продаж использовал целевую рассылку в LinkedIn, направленную на определенные комитеты по закупкам. Эта интеграция снизила процент отказов электронной почты ниже 5%, вдвое уменьшила полную стоимость привлечения клиента (CAC) и ускорила скорость обработки заявок, восстановив соотношение LTV:CAC до высокоэффективного уровня 4:1.
Нормативно-правовые рамки как коммерческие триггеры
В отраслях промышленности с жестким регулированием сроки соблюдения требований выступают в качестве основных коммерческих триггеров. По мере приближения дат вступления в силу нормативных актов, объемы поисковых запросов по конкретным решениям в области соответствия увеличиваются, сигнализируя о периодах высокой заинтересованности в покупке.
Обязательные раскрытия информации в рамках 3-й области
Под Руководство по Директиве об отчетности в области корпоративной устойчивости, В настоящее время отчетность по выбросам категории Scope 3 перестала быть добровольным раскрытием информации и стала обязательной по закону. В текущем отчетном периоде эти требования распространяются на крупные компании, отвечающие как минимум двум из трех критериев: более 250 сотрудников, выручка более 50 миллионов евро или совокупные активы более 25 миллионов евро. Scope 3 требует полной количественной оценки всех существенных косвенных выбросов в цепочке создания стоимости, которые Как правило, на долю таких предприятий приходится от 701 до 901 тонны углеродного следа.. Поскольку декарбонизация электроэнергии, поставляемой поставщиками, является наиболее прямым методом сокращения выбросов категории 3, отделы закупок внедряют обязательные требования по отслеживанию и сокращению выбросов углерода непосредственно в процесс выбора поставщиков.
Обязательства по обеспечению кибербезопасности в цепочке поставок
В Северной Америке правила регулирования систем электроснабжения, подробно описанные в Обзор программы NERC CIP Вводят строгие требования. NERC CIP-013 (Управление рисками в цепочке поставок) требует от коммунальных предприятий внедрения формализованных механизмов контроля закупок и оценки рисков для обеспечения безопасности оборудования, программного обеспечения и услуг. Одновременно NERC CIP-005 регулирует сеансы удаленного доступа к критически важным периметрам безопасности, требуя многофакторной аутентификации и шифрования. В соответствии с Постановлением FERC № 887, коммунальные предприятия должны внедрить систему мониторинга внутренней сетевой безопасности (INSM) для систем с внешним маршрутизируемым подключением. Несоблюдение NERC CIP или нормативных правил, применяемых Управление газового и электроэнергетического рынков (OFGEM) сопряжен с серьезными операционными рисками, включая ежедневные штрафы и немедленное исключение поставщиков из списка.
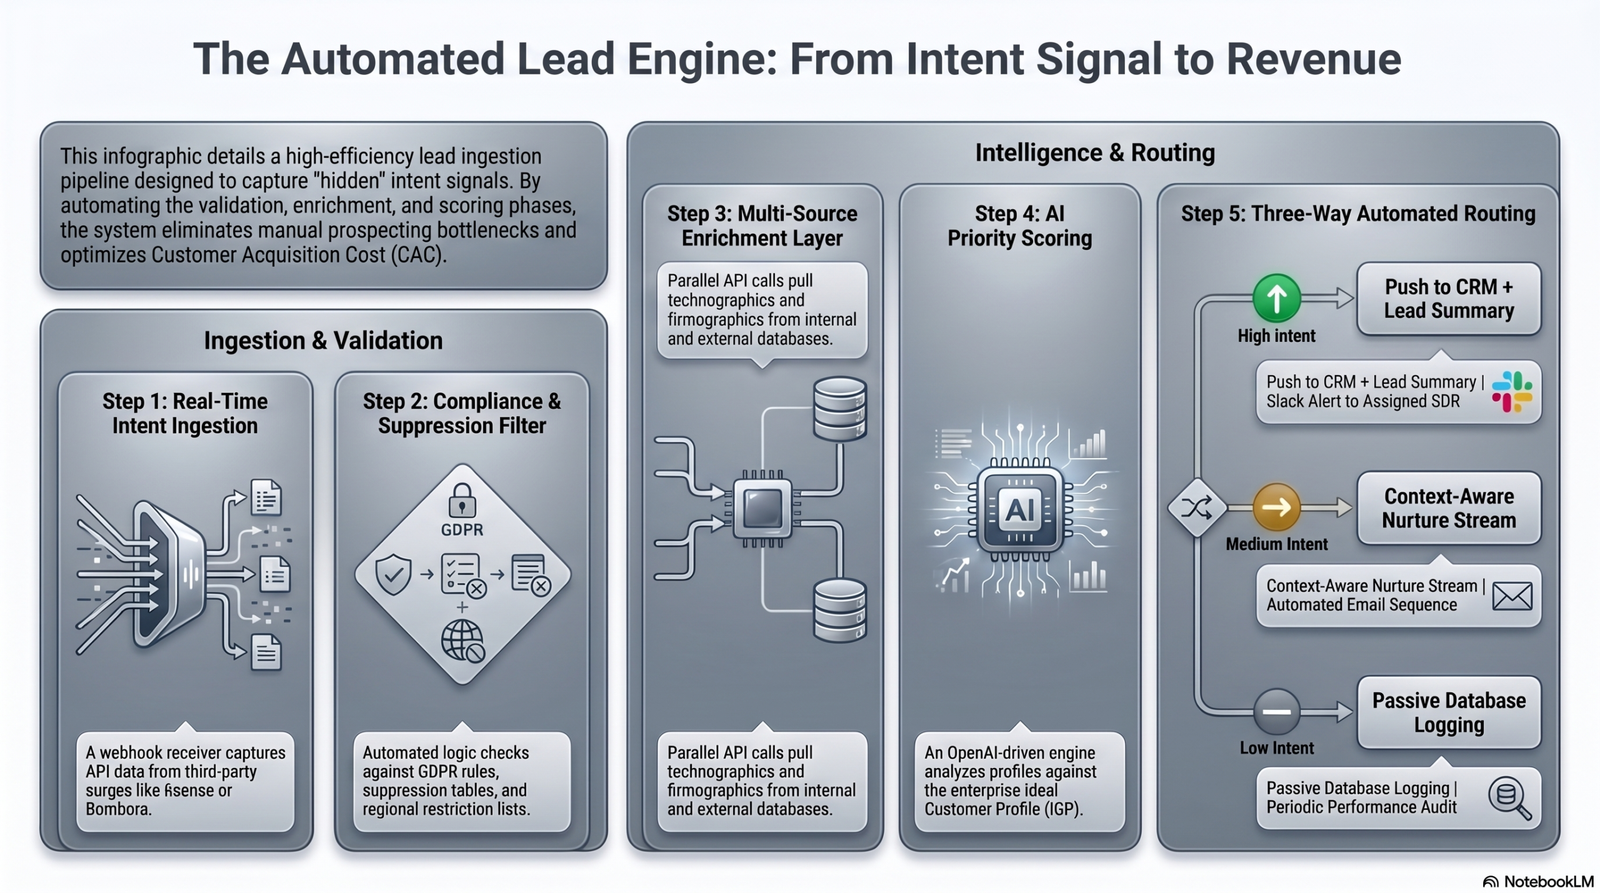
Архитектуры автоматизированной обработки и экономика отдельных блоков
Для масштабирования коммерческой деятельности без увеличения штата сотрудников организациям необходимо внедрять автоматизированные системы управления лидами с использованием низкокодовых движков, таких как n8n. Стандартный производственный рабочий процесс работает на основе событийно-ориентированной архитектуры, которая обрабатывает веб-хуки, выполняет обогащение данных из различных источников и автоматически оценивает намерения с помощью больших языковых моделей. Этот процесс сокращает время обработки лидов и предоставляет предварительно квалифицированные, обогащенные возможности непосредственно отделу продаж, устраняя узкие места, связанные с ручным поиском потенциальных клиентов.
Для защиты оценочной стоимости компаний финансовые заинтересованные стороны осуществляют мониторинг Правило 40, Требуется, чтобы совокупный темп роста выручки компании и маржа EBITDA равнялись или превышали 40%. Финансовые директора рассчитывают полную стоимость привлечения клиента ($CAC$) по следующей формуле:
$$CAC = frac{text{Компенсация за продажи} + text{Маркетинговые расходы} + text{Программное обеспечение} + text{Поездки} + text{Накладные расходы}}{text{Привлеченные новые клиенты}}$$
Поскольку затраты на привлечение клиентов в сегменте B2B за последние пять лет выросли на 601 тыс. долл. США, что обусловлено... Увеличение цены за клик в Google Ads на 164% и ан Резкий рост стоимости рекламы в LinkedIn (89%).— Неэффективные каналы сбыта напрямую снижают операционную прибыль. Корпоративная стоимость предприятия ($EV$) математически определяется следующим образом:
$$EV = текст{EBITDA} × M_{text{EBITDA}}$$
К первому кварталу 2026 года медианный мультипликатор EV/EBITDA для компаний, работающих в сфере зеленой энергетики, стабилизировалось на уровне 16,3x. Для поставщика услуг, генерирующего EBITDA в размере 1 000 000 долларов США, этот мультипликатор устанавливает стоимость предприятия в размере 1 0 ...
| Сегмент | Средняя стоимость капитализации | Длительность цикла продаж | Соотношение LTV:CAC |
| SMB SaaS | $100 – $400 | 1–3 месяца | 4:1 до 6:1 |
| SaaS для среднего бизнеса | $400 – $800 | 3–6 месяцев | 4:1 до 7:1 |
| Корпоративное SaaS | $800+ | 6+ месяцев | 4:1 до 10:1 |
Для смягчения этих потерь операторы должны оптимизировать скорость потока B2B в трубопроводе ($PV$), которая рассчитывается следующим образом:
$$PV = frac{O times D times W}{C}$$
Где:
-
$PV$ обозначает скорость обработки заявок (измеряется в выручке, полученной за день).
-
$O$ обозначает количество перспективных проектов, находящихся в активной стадии разработки.
-
$D$ обозначает средний размер сделки или годовую стоимость контракта (ACV).
-
$W$ обозначает исторический процент выигрышей.
-
$C$ обозначает среднюю продолжительность цикла продаж, измеренную в днях.
Техническая машинная читаемость и оптимизация генеративного механизма
Переход от традиционного индексирования поисковых систем к разговорному искусственному интеллекту требует перехода от традиционной SEO-оптимизации к генеративной оптимизации поисковых систем (GEO). 73% покупателей B2B используют инструменты разговорного искусственного интеллекта Для составления списков потенциальных поставщиков веб-сайты должны оставаться видимыми для поисковых индексаторов, таких как Googlebot, Bingbot, OAI-SearchBot, Claude-SearchBot и PerplexityBot.
Для обеспечения включения в рекомендации, генерируемые искусственным интеллектом, технические команды должны поддерживать следующее:
-
Разметка схемы JSON-LD: Внедрите комплексные схемы для разделов «Статьи», «Организация», «Часто задаваемые вопросы», «Продукты» и «Как сделать», чтобы явно отображать взаимосвязи между сущностями.
-
Структура контента, основанная на цитировании: В первых 60-120 словах страниц, представляющих высокую ценность, размещайте прямые, содержательные ответы.
-
Циклы непрерывного обновления контента: С 85% поисковых запросов, связанных с ИИ, получены из контента, обновленного за последние два года., Для сохранения реферального трафика необходимы ежемесячные обновления расписания.
Подробные технические параметры сканирования задокументированы в нашей корпоративной документации. идеи репозиторий.
Основные операционные выводы для корпоративного руководства
-
Путь покупателя в значительной степени определяется его собственными действиями: Покупатели в сегменте B2B проходят 611-30 этапов своего пути до контакта с отделом продаж, в значительной степени полагаясь на разговорный искусственный интеллект и независимые исследования.
-
Насыщенность исходящего рынка снижает оценку стоимости: Чрезмерное распределение капитала в пользу небольшого числа активных покупателей, находящихся на рынке (5%), приводит к увеличению стоимости привлечения клиента (CAC) и вызывает сбои в доставке доменов.
-
Внедрение нормативных требований определяет временные рамки для закупок: Приближающиеся сроки выполнения требований CSRD, NERC CIP и SECR служат основными триггерами для начала процесса закупок.
-
Автоматизация оптимизирует коммерческий процесс: Интеграция данных о намерениях в режиме реального времени с автоматизированными конвейерами n8n ускоряет проверку потенциальных клиентов и устраняет узкие места, связанные с ручной обработкой данных.
-
Высокая скорость транспортировки по трубопроводам обеспечивает сохранение операционной EBITDA: Защита масштабов сделок и сокращение циклов продаж напрямую защищают стоимость предприятия и корпоративные мультипликаторы.
Об авторе
Project 54 Team — это старший консультант по стратегии в Project 54, специализирующийся на цифровой трансформации промышленности и создании платформ управления на основе искусственного интеллекта для энергетического сектора.